
How Historical Data Drives Predictive Process Analytics
Business Efficiency
Jun 1, 2025
Explore how historical data informs predictive analytics, enhancing efficiency, reducing costs, and driving informed decision-making across industries.
Historical data is the backbone of predictive analytics. It helps businesses forecast future outcomes, optimize operations, and make informed decisions. By analyzing past trends and patterns, companies can identify risks, improve efficiency, and enhance customer experiences.
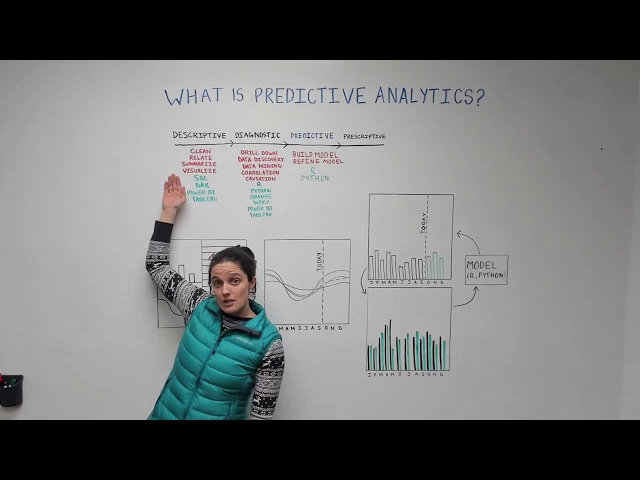
What is Predictive Process Analytics? It uses historical data to predict future outcomes through models like regression, clustering, and anomaly detection.
Why is Historical Data Important? It reveals patterns, sets performance benchmarks, and helps understand cause-and-effect relationships.
Practical Applications: Predictive maintenance cuts costs and downtime in manufacturing. E-commerce uses it to boost sales with personalized recommendations. Healthcare improves patient care and operational efficiency.
For businesses, success lies in combining historical data with real-time inputs, ensuring data quality, and using the right tools like machine learning and process mining to turn insights into action.
The Fundamentals of Predictive Analytics - Data Science Wednesday
How Historical Data Gets Used in Predictive Analytics
After recognizing the importance of historical data, the next step is figuring out how to put it to work. Businesses use a variety of techniques to turn past records into actionable insights, helping them anticipate future outcomes and improve operations. These methods pave the way for identifying patterns and setting benchmarks that guide decision-making and performance evaluation.
Finding Patterns and Trends
At the heart of predictive analytics is the ability to uncover patterns within historical data. Time series models are particularly useful for spotting recurring trends or seasonal behaviors. These models analyze data collected at consistent intervals, allowing businesses to predict future values based on historical patterns.
Another powerful tool is clustering models, which group similar data points together. This approach reveals relationships that might not be immediately obvious, such as customer segments or operational similarities. Meanwhile, anomaly detection models act like sentinels, identifying unusual patterns that could signal risks or opportunities. By learning what "normal" looks like, these models flag deviations that require attention.
However, even the best models rely on high-quality data. Collecting, cleaning, and preparing data is essential for generating reliable predictions. Once the data is ready, businesses use feature selection to focus on the variables most relevant to predicting specific outcomes.
A great example of pattern recognition in action comes from Geisinger Health. They analyzed health records from over 10,000 sepsis patients to create a predictive model that improved diagnosis and treatment. The result? A model that accurately identified patients with a high likelihood of survival.
These patterns not only enable predictions but also establish benchmarks for measuring performance.
Setting Performance Baselines
Once trends are identified, historical data helps create benchmarks that serve as reference points for future performance. These baselines make it easier to spot deviations and take proactive steps.
"Baseline data is the backbone of predictive maintenance. By establishing and maintaining accurate benchmarks, businesses can detect issues early, enhance equipment reliability, and save costs." – DXP Pacific
To build effective baselines, companies must collect data under optimal conditions and use reliable tools. The baselines should be both realistic and measurable within a set timeframe.
Consider a bridge construction project that used a tiered approach to baselines. By setting milestones at three levels - overall project goals, phase-specific targets, and weekly work packages - the project finished two months early and came in 5% under budget. Similarly, Intel refined its cost estimates during project planning by combining historical data with expert insights, demonstrating how baselines can evolve as more data becomes available.
Regularly updating baselines ensures they remain accurate and support ongoing predictive efforts.
Understanding Cause and Effect in Processes
Historical data does more than highlight trends - it helps businesses understand the causal relationships behind their processes. This deeper insight allows organizations to identify which factors truly influence outcomes, rather than mistaking correlation for causation.
Regression analysis is a key tool for uncovering these relationships. Harvard Business School Professor Jan Hammond explains:
"Regression allows us to gain insights into the structure of that relationship and provides measures of how well the data fit that relationship. Such insights can prove extremely valuable for analyzing historical trends and developing forecasts."
By combining statistical models, data mining, and machine learning, businesses can dig deeper into their data to understand not just what happened, but why it happened. This approach helps pinpoint risks and uncover opportunities.
For instance, a plastics and thin film manufacturer used historical equipment data to identify failure patterns. Their predictive maintenance program now saves $54,000 every month by reducing downtime and waste. Similarly, Building IQ applied causal analysis to improve energy efficiency in commercial buildings. By understanding the factors affecting energy use, their system cut HVAC energy consumption by 10–25% during regular operations.
The key to success lies in continuously monitoring model performance and updating models as new data comes in. This ensures businesses maintain an accurate understanding of cause-and-effect relationships, even as conditions change.
With these insights, historical data takes on a strategic role, driving smarter decisions and better outcomes.
Tools and Methods for Predictive Analytics
Historical data holds the key to understanding trends, but it’s the right tools and methods that turn those insights into actionable predictions. By combining advanced techniques like process mining and machine learning with meticulous data preparation, businesses can unlock predictive capabilities that improve operations and decision-making.
Process Mining Algorithms
Process mining algorithms use mathematical techniques to extract process models from business data. A great example of this is at Brussels Airport, where a combination of Random Forest and LSTM neural networks was used to predict baggage processing times. This approach reduced the mean absolute error to 56 minutes and improved accuracy by 5 minutes compared to static models. It also revealed critical factors influencing delays, such as flight schedules and arrival times. Once these patterns are identified, machine learning models can take over to forecast future outcomes.
Machine Learning Models
While process mining focuses on uncovering historical patterns, machine learning models are all about predicting what’s next. Predictive process mining leverages various machine learning algorithms, and the choice between supervised and unsupervised methods can greatly affect both accuracy and how easily results can be interpreted.
Supervised algorithms like support vector machines, regression models, decision trees, and random forests work well when past outcomes are clearly documented. These models are transparent, making it easier to understand their decision-making process.
Unsupervised methods such as RNNs and LSTMs are better suited for uncovering complex patterns but can be harder to interpret.
Deep learning models often deliver the highest accuracy, though they may come at the cost of explainability.
"The future of process management lies in a balanced integration of Object-Centric Process Mining (OCPM) and AI, leading to more efficient, compliant, and optimized operational processes."
– Prof.dr.ir. Wil van der Aalst, Process and Data Science, RWTH Aachen University
When choosing an algorithm, it’s essential to consider the goal. For applications requiring transparency - like regulatory compliance - supervised models are often the best choice. On the other hand, if accuracy is the primary objective, deep learning may be the way to go.
Data Preparation and Feature Engineering
Even the most advanced algorithms depend on high-quality data. That’s where data preparation and feature engineering come into play.
Data collection: Gather historical records, real-time feeds, and both structured and unstructured data.
Data cleansing: Address inconsistencies, such as missing values, using methods like mean or median imputation - or more advanced techniques.
Feature selection: Focus on identifying the most relevant variables for the prediction task.
Normalization and standardization: Ensure comparability between data on different scales, such as dollar amounts versus time measurements.
Outlier detection: Identify and correct unusual data points that could distort model accuracy.
Model validation is another critical step. Techniques like cross-validation help test a model’s stability and ensure it performs well on new data. Regular monitoring is also necessary to keep models updated as conditions change.
Practical Applications and Case Studies
Building on the previously discussed methods and tools, these real-world examples highlight how historical data can be applied effectively in predictive process analytics.
Predictive Maintenance in Manufacturing
Manufacturers are tapping into historical equipment data to avoid costly breakdowns. According to Deloitte, predictive maintenance can cut downtime by 5-15% and improve labor productivity by 5-20%. Considering that unplanned downtime drains about 11% of the annual turnover of Fortune Global 500 companies, the financial benefits are hard to ignore.
Take Ajinomoto Health and Nutrition North America as an example. They rely on AVEVA's PI historian to gather equipment data and use SAM GUARD software to detect anomalies. By training their system with over two years of process data, they’ve been able to identify issues like a motor set point error in a fluidized bed dryer. This allows them to schedule maintenance proactively, avoiding production delays.
"Historical data plays a significant role in preventive maintenance strategies by providing detailed information on each asset and piece of equipment, such as previous repair history, inventory parts information, and current equipment condition." – Ronak Macwan, senior industry marketing manager for manufacturing at Brightly Software, a Siemens Company
Improving Customer Journeys in E-commerce
In e-commerce, where only 2-3% of visitors typically make a purchase, understanding customer behavior through historical data is crucial for boosting sales and improving user experiences.
ASOS, a major online fashion retailer, has used data-driven strategies to increase conversion rates significantly. By analyzing customer interaction data, they’ve introduced personalized product recommendations, conducted UX A/B testing, refined user experience design, launched targeted email campaigns, and optimized their mobile platform.
Historical data helps identify patterns in clicks and page views, pinpointing where customers drop off during their journey. Predictive analytics then leverages purchase history to anticipate buying behavior, enabling businesses to send personalized offers at the perfect time.
Healthcare Workflow Improvements
While retail focuses on customer journeys, healthcare has seen equally transformative results by using historical data to streamline operations and improve patient care.
For instance, Al Hada Armed Forces Hospital in Taif, Saudi Arabia, implemented a case management program between September 2019 and September 2022, using historical patient flow data to drive improvements. The results were striking: the average hospital stay dropped from 11.5 to 4.4 days, emergency department boarding times fell from 11.9 to 1.2 hours, and bed turnover rates improved from 0.57 to 0.93. These changes led to cost savings of 123,130,192 Saudi Riyals (approximately $32.8 million USD).
Beyond this, healthcare systems using analytics have reported a 15% boost in operational efficiency. By reducing unnecessary delays and better managing resources, these systems have improved workforce productivity and patient outcomes. Data-driven health strategies have also increased early disease detection rates by over 20%, cutting down on emergency visits and hospitalizations.
Organizations like Converge Technology Solutions and IBM are leveraging generative AI to streamline processes further. For example, they’ve used AI to extract health plan requirements and analyze records, reducing prior authorization times from weeks to mere minutes.
"Healthcare data analytics help create a more holistic view of large, complex data. This in turn helps improve patient health, care quality, and healthcare cost and resource management." – Inovalon
From avoiding equipment failures to personalizing shopping experiences and improving patient care, these examples show how combining historical data with advanced analytics can lead to measurable improvements across industries.
Common Challenges and Best Practices
The growing use of predictive analytics across industries like manufacturing, e-commerce, and healthcare underscores its potential, but implementing it is far from straightforward. While the field continues to expand - valued at $14.9 billion in 2023 and projected to hit $41.44 billion by 2028 - organizations grapple with significant challenges. Tackling these hurdles is essential to turning historical data into actionable insights and long-term advantages.
Data Quality and Availability Issues
One of the biggest roadblocks in predictive analytics is poor data quality. In fact, up to 60% of the time in predictive projects is spent on data cleansing, and downtime costs can exceed $5,600 per minute. Problems like missing values, inconsistent formats, outdated records, and noise can throw predictions off course. For instance, inaccurate inventory data in retail can lead to flawed demand forecasts, while incomplete medical records in healthcare can delay critical interventions.
Another issue is data bias, which can distort predictions. To address this, organizations can start small - integrating a few key data elements and gradually expanding their datasets to boost model performance. Separating historical, new, and prediction data into distinct systems can also help streamline data management. Machine learning methods can assist by identifying and fixing missing values or outliers, while techniques like over-sampling, under-sampling, and SMOTE (Synthetic Minority Oversampling Technique) can tackle data bias.
Combining Historical and Real-Time Data
Integrating historical and real-time data offers more dynamic and accurate predictions but introduces its own set of challenges. Real-time data allows models to adapt to the latest information, but merging these sources can be technically demanding. For example, 76% of asset-intensive companies use predictive analytics to improve efficiency, and in the automotive sector, unplanned downtime can cost manufacturers $22,000 per minute.
Some success stories highlight the power of this integration. XMPro, for instance, helped mining operations reduce unplanned downtime by 25% by combining sensor data, operational logs, and historical analysis. Similarly, a manufacturer achieved a 30% drop in downtime by monitoring machine health through predictive analytics. Tools like Apache Kafka for data streaming and Apache Flink for stream processing are key to managing such integrations.
Building a strong predictive analytics framework starts with a solid data strategy. This includes planning for data collection, ensuring data quality, and setting up storage systems that can handle both historical and real-time data. Investing in AI tools, integrating real-time inputs like CRM systems or social media data, and assembling a cross-functional team of data scientists, IT experts, and business strategists are also critical steps.
Making Models Easy to Understand
Even the most accurate models can fall short if decision-makers don’t understand how they work. Striking a balance between accuracy and interpretability is essential. Simpler models like linear regression and decision trees are easier to explain, while more complex ones, such as neural networks, may require tools like LIME or SHAP to clarify predictions.
Feature selection and engineering can also improve both clarity and effectiveness. By focusing on the most relevant variables - often identified through correlation analysis - models become more transparent. Evaluating performance using metrics like Mean Absolute Error (MAE), Mean Squared Error (MSE), and R-squared (R²) for regression, or Precision, Recall, F1-score, and Area Under Curve (AUC) for classification, helps stakeholders grasp how well a model is performing. Ongoing monitoring and feedback loops ensure models stay accurate and aligned with business goals over time.
Addressing these challenges is key to unlocking the full potential of historical data, enabling businesses to make smarter, data-driven decisions and achieve sustainable growth.
Conclusion: Using Historical Data to Drive Business Growth
Historical data has become a cornerstone for shaping business strategies, revolutionizing how companies make decisions and plan for the future. This shift aligns with the rapid growth of the global predictive analytics market, which is projected to climb from $17.07 billion in 2024 to $20.77 billion in 2025 and reach an impressive $91.92 billion by 2032.
This surge highlights a fundamental transition from reactive to proactive decision-making. As Giuseppe Iafulli from Kleene.ai explains:
"Predictive data analytics is changing the way UK businesses operate. It's not simply about looking back; it's about anticipating the future and making proactive choices".
The impact of predictive analytics is evident across various industries. For example, PepsiCo's Sales Intelligence Platform uses retailer and supply chain data to forecast out-of-stock scenarios, ensuring smoother operations. Similarly, Rolls-Royce leverages predictive analytics to lower carbon emissions and streamline maintenance schedules. Even in e-commerce, Amazon's advanced demand forecasting algorithms contributed to approximately 35% of its total revenue in 2020.
Adopting data-driven strategies also delivers measurable financial benefits. Companies leveraging historical data report a 6% boost in profitability, thanks to better risk management, reduced waste, and early identification of opportunities. Additionally, businesses can refine their marketing efforts and design highly targeted cross-sell campaigns using these insights.
To make the most of historical data, businesses should focus on three key areas: defining critical business questions, ensuring data quality, and fostering collaboration across teams. Dharmesh Acharya, COO of Radixweb, emphasizes this approach:
"Data should not be restricted to the role of a tool. From market expansion to product development and product positioning, we dive deep into data for strategic decision making".
FAQs
How can businesses ensure their historical data is accurate and reliable for predictive analytics?
To make sure historical data is trustworthy and effective for predictive analytics, businesses need to uphold strict data quality standards. This means ensuring the data is accurate, complete, consistent, timely, and relevant. Problems like duplicate records, missing details, or mismatched formats can lead to errors in predictive models, so addressing these issues is crucial.
Using data cleaning and preprocessing techniques is another key step. These methods help standardize and validate data, ensuring it's ready for analysis. Automating data quality checks can also be a game-changer, allowing companies to continuously monitor and maintain data integrity. By focusing on these strategies, businesses can build more reliable analytics and make smarter, data-driven decisions with greater confidence.
What challenges do businesses face when combining historical data with real-time inputs for predictive analytics?
Integrating historical data with real-time inputs to power predictive analytics comes with its fair share of challenges. One of the biggest hurdles is data quality. Historical data often suffers from issues like being incomplete, outdated, or riddled with inaccuracies. These problems can throw off predictions, making them less reliable.
Another common roadblock is the presence of data silos. When information is scattered across multiple systems that don’t talk to each other, it becomes incredibly difficult to access and use that data effectively.
On top of that, there are technical challenges. Combining data from different formats and sources can be a messy, complex process. And let’s not forget the human element - employees who are used to traditional workflows may resist adopting new predictive analytics tools, which can slow progress.
To tackle these issues, businesses need a clear strategy that focuses on improving data management, training teams to embrace new tools, and ensuring smooth system integration.
How do machine learning models influence the accuracy and clarity of predictive analytics across industries?
Machine learning models are at the heart of predictive analytics, influencing both how accurate and how understandable predictions can be across different industries. Simpler models - like linear regression or decision trees - are often favored because they strike a balance between precision and clarity. These models shine in fields like finance and healthcare, where decisions need to be based on clear, actionable insights derived from historical data.
In contrast, advanced models such as neural networks can achieve higher levels of accuracy but often lack transparency. This "black box" nature can create challenges, particularly in areas like healthcare, where it’s crucial to understand the reasoning behind a prediction. The choice of model ultimately hinges on the specific requirements of the industry, weighing the need for precision against the value of interpretability.